Recording NTP Statistics
Keeping an eye on your system is important to spot problems. It's also very handy if you want to experiment and try to improve performance.
This part of the guide explains how to use Glances and Chrony_Exporter to make key information available to Prometheus (for storage) and Grafana (for viewing).
Requirements
- An existing Prometheus installation on your local network
- A Grafana instance linked to Prometheus
Installing Glances
Glances is my favourite monitoring tool by a long way. It can be a little intimidating to set up if you're new to Linux (as I am), so the steps I follow are outlined below.
 nicolargo
To get most of the work out of the way, run the Glances install script, as below:
curl -L https://bit.ly/glances | /bin/bashThis will fail near the end (as of Jan 2024) due to security changes. You can override this using the command below.
sudo pip install setuptools glances prometheus_client --break-system-packages
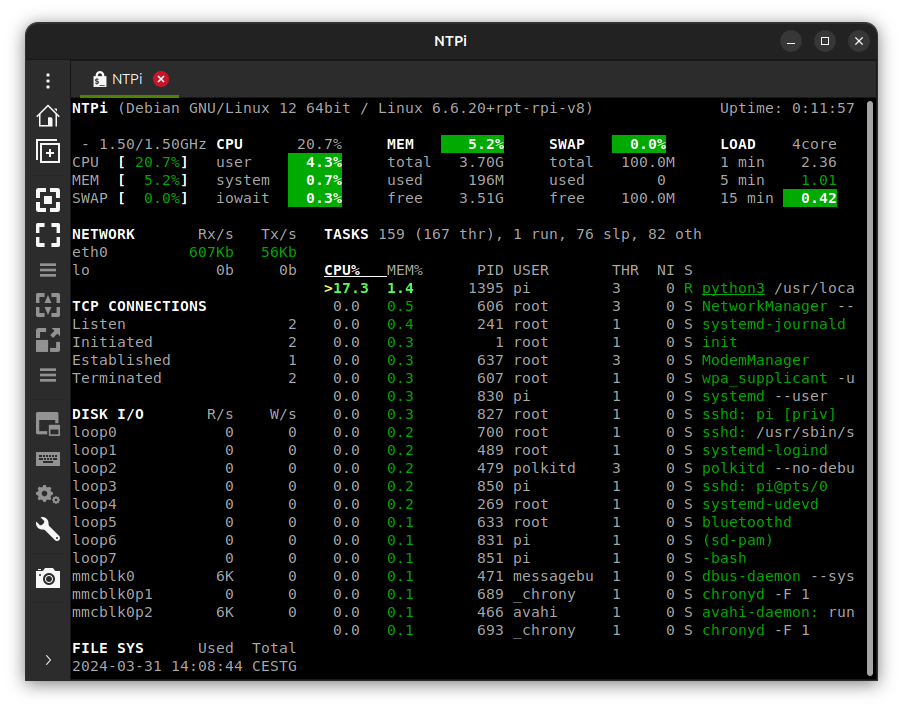
Once installed, we can do a quick check to see that Glances works
glancesYou should see the following:
Now we need to get the template glances.conf file:
https://raw.githubusercontent.com/nicolargo/glances/master/conf/glances.conf
We'll make a few edits to it to allow it to talk to Prometheus.
Go down to the section that starts with [prometheus] and set the following lines
host=[Your Pi's IP goes here]
port=9091
prefix=glances_NTPi
# Use any prefix you want
labels=src:glances
Personally, I also go to the top section called [global] and set refresh to 60 seconds, then I set disable to 'True' in the following sections: [quicklook], [system], [percpu], [gpu], [memswap], [ip], [diskio], [folders], [hddtemp], [processcount], [processlist], [ports], and [containers]. This reduces the amount of data we're recording and storing that isn't of as much interest when experimenting with NTP.
Now that glances.conf is edited, create a folder at /etc/glances/ and move glances.conf there.
sudo mkdir /etc/glances/
sudo mv /home/pi/glances.conf /etc/glances/
Now to test it
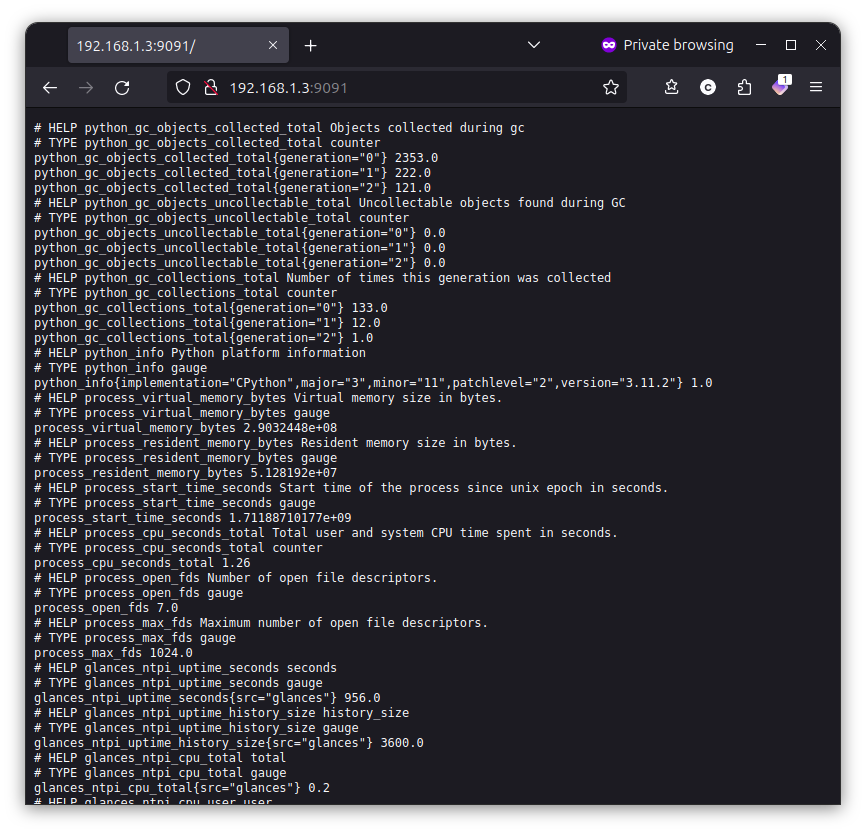
/usr/local/bin/glances --export prometheus -C /etc/glances/glances.conf --quiet
And go to your Pi's IP address (port 9091) in a web browser to check that it's working.
All good, so let's make this a service that starts automatically on boot.
sudo nano /etc/systemd/system/glances.servicePaste the following into the file
[Unit]
Description=Glances
After=network.target

[Service]
ExecStart=/usr/local/bin/glances --export prometheus -C /etc/glances/glances.conf --quiet
User=pi
Restart=on-failure
RemainAfterExit=yes
RestartSec=30s
TimeoutSec=30s

[Install]
WantedBy=multi-user.target
Now enable the service
sudo systemctl enable glances.serviceAnd start the service
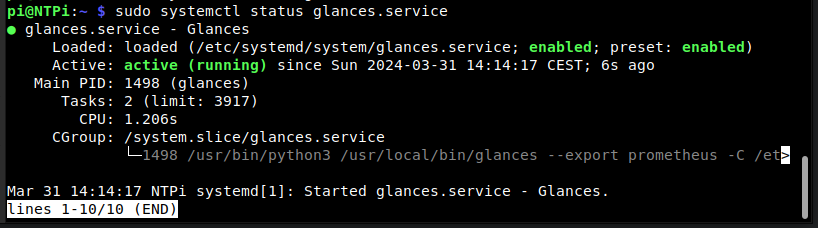
sudo systemctl start glances.serviceLet's check that it's running properly
sudo systemctl status glances.serviceYou should see the following:
If so, let's reboot and make sure that it comes up correctly.
sudo rebootOnce back up, check the status again.
sudo systemctl status glances.serviceIf it's all working, you'll see the same output as before the reboot, and checking the Pi's IP (port 9091) will give the same info page.
Installing Chrony_Exporter
Github user SuperQ has made an excellent prometheus exporter for Chrony data that's really easy to use.
SuperQGo to the releases page and get the correct version for your hardware. If running a Pi 3, 4, or 5 with the 64 bit OS, choose linux-arm64.
Extract the archive and move to /usr/local/bin/
sudo mv /home/pi/chrony_exporter /usr/local/bin/
Make it executable
sudo chmod +x /usr/local/bin/chrony_exporter
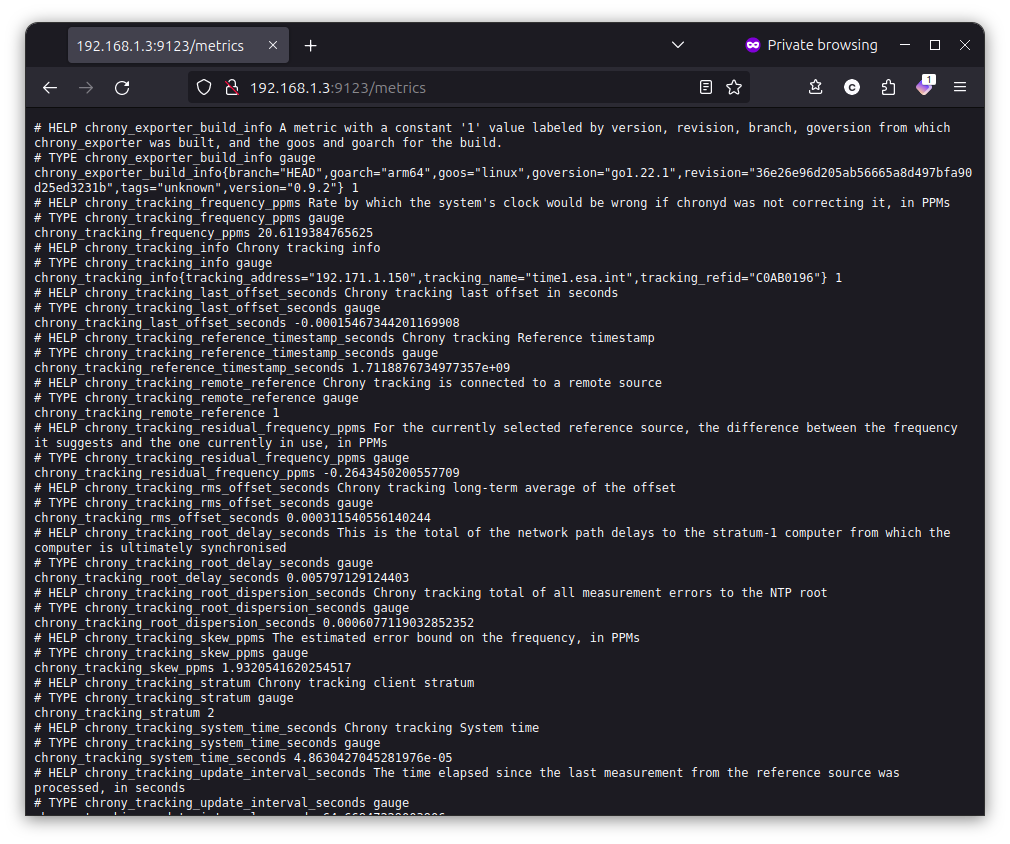
And run it
chrony_exporterGo to your Pi's IP address (port 9123) and click on 'Metrics'. You should see a familiar style of page.
If it's working, let's make this a service that starts automatically on boot as well.
sudo nano /etc/systemd/system/chrony_exporter.servicePaste in the following
[Unit]
Description=chrony_exporter
After=network.target

[Service]
ExecStart=/usr/local/bin/chrony_exporter --no-collector.dns-lookups
Restart=on-abort
RemainAfterExit=yes

[Install]
WantedBy=multi-user.target
The '--no-collector.dns-lookups' modifier greatly reduces the number of DNS queries that the exporter generates.
Now enable the service
sudo systemctl enable chrony_exporter.serviceAnd start the service
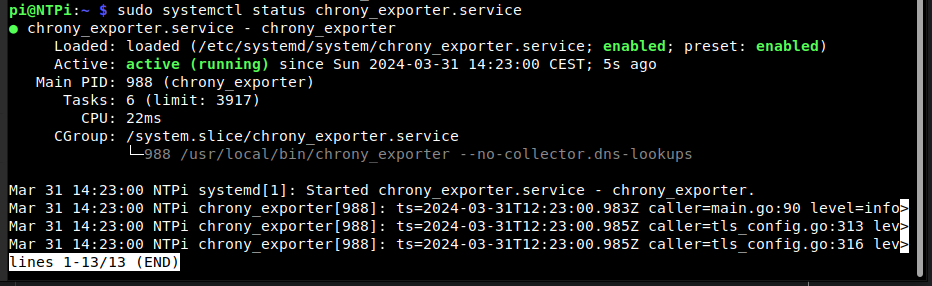
sudo systemctl start chrony_exporter.serviceLet's check that it's running properly
sudo systemctl status chrony_exporter.serviceYou should see the following:
If so, let's reboot and make sure that it comes up correctly.
sudo rebootOnce back up, check the status again.
sudo systemctl status chrony_exporter.serviceIf it's all working, you'll see the same output as before the reboot, and checking the Pi's IP (port 9123) will give the same info page.
Adding the Glances and Chrony sources to Prometheus
Now that the Raspberry Pi is exposing lots of useful data, we can use our Prometheus instance to record it.
Add the following lines to your prometheus.yml file and restart prometheus
- job_name: 'glances_NTPi'
scrape_interval: 60s
static_configs:
- targets: ['[Your Pi's IP goes here]:9091']
- job_name: 'chrony_NTPi'
scrape_interval: 10s
static_configs:
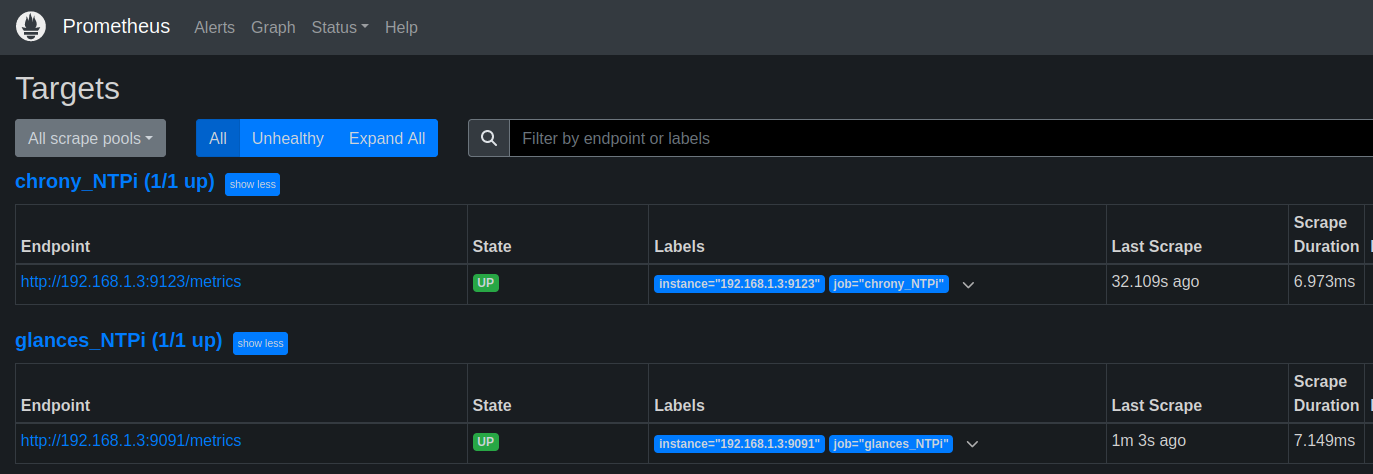
- targets: ['[Your Pi's IP goes here]:9123']If it's working, you should see the targets' state as 'UP' after a minute or two.
Adding the Glances and Chrony data to Grafana
Now we're recording all these stats, let's do something with them!
If you've got a Grafana instance connected to Prometheus, you can easily make dashboards for both Glances and Chrony data. This will help to keep an eye on your system, and to see the effect of any tweaks an changes you may make down the line.
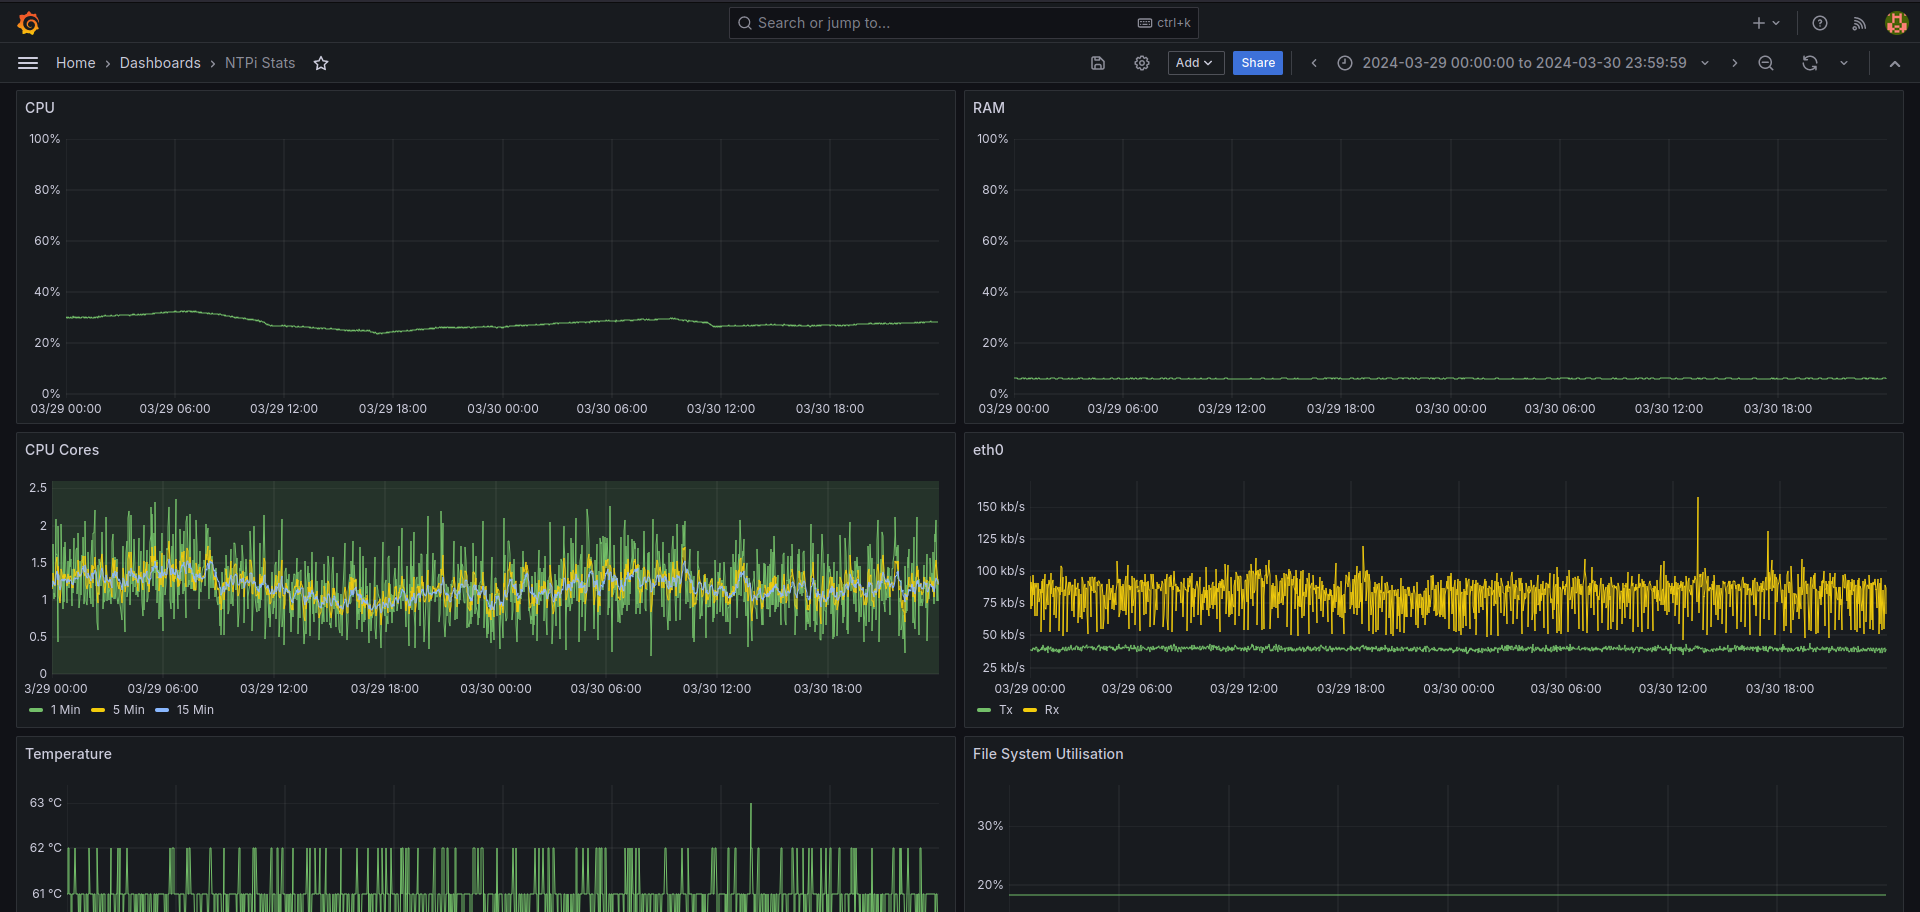
Glances Dashboard
Below is a Grafana dashboard that shows the stats we're recording from Glances. If you'd like to import it, a json file can be found below the screenshot.
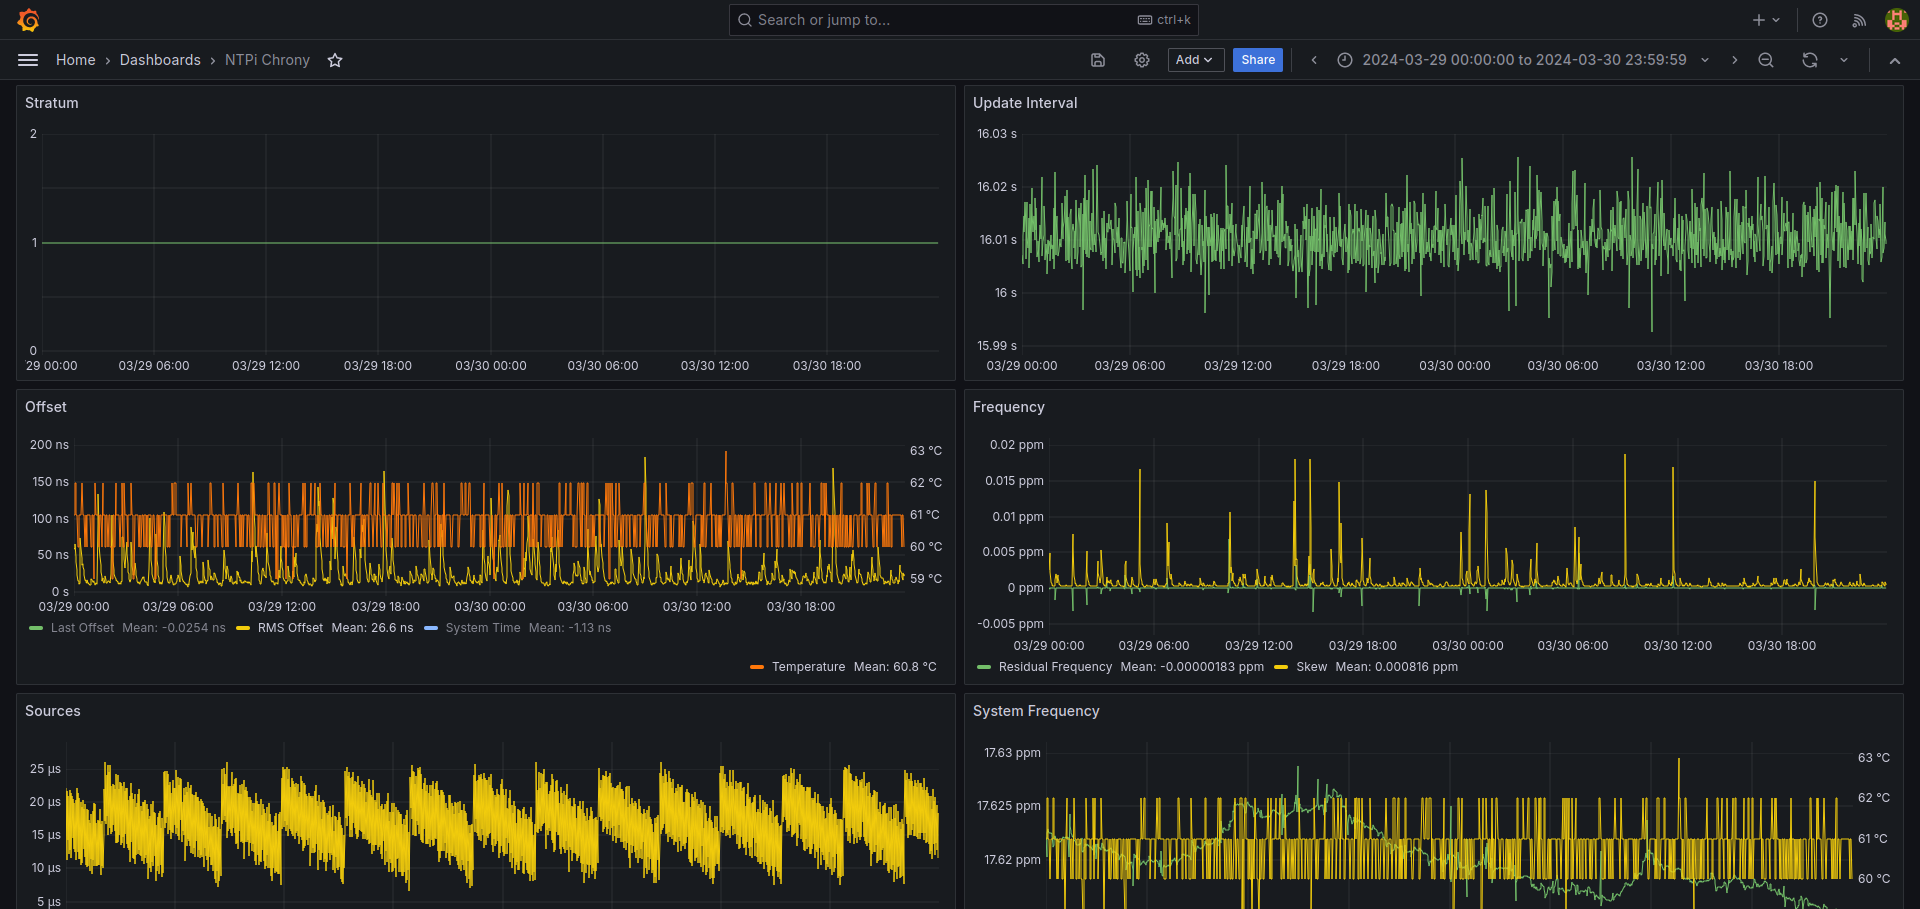
Chrony Dashboard
Below is a Grafana dashboard that shows the stats we're recording from Chrony. If you'd like to import it, a json file can be found below the screenshot.